Business Intelligence (BI) reporting tools have become essential for organisations of all sizes and industries. These tools empower businesses to make cognisant decisions by transforming raw data into actionable insights. However, for beginners, the world of BI reporting tools can seem complex and overwhelming.
This guide aims to demystify BI reporting tools, offering a comprehensive introduction to their fundamentals, benefits, and critical considerations.
What is Business Intelligence?
Business Intelligence (BI) is a technology-driven process of collecting, analysing, and presenting data to help businesses make informed decisions. It involves using various tools, techniques, and strategies to transform raw data into actionable insights. These insights can range from simple trends and patterns to complex predictive analytics.
BI enables organisations to uncover hidden opportunities, identify potential issues, and optimise their operations. It provides a solid foundation for data-driven decision-making, which is crucial in today’s competitive business landscape.
What is the Role of Reporting in BI?
Reporting is a fundamental component of BI. It involves creating and delivering visual representations of data, such as charts, graphs, and tables. Reports help users understand data more effectively, facilitating decision-making processes. BI reporting tools are pivotal in generating, customising, and sharing these reports.
Why Should You Use Reporting Tools in BI?
BI reporting tools are essential because they bridge the gap between raw data and actionable insights. They empower users to extract valuable information from complex datasets without requiring in-depth technical skills.
Likewise, these tools enhance the accessibility, usability, and comprehensibility of data, making it easier for individuals across an organisation to collaborate and make informed choices.
What are the Common Features of Good BI Reporting Tools?
Now that we’ve established the importance of BI reporting tools, let’s delve deeper into their standard features. BI reporting tools offer a range of features designed to facilitate data analysis and reporting. Understanding these features is crucial for beginners. Here are some of the most common features you’ll encounter:
Data Visualisation
Data visualisation is representing data graphically, allowing users to grasp information quickly. BI reporting tools offer various visualisation options, including bar charts, pie charts, line graphs, heatmaps, etc. Users can select the most suitable visualisation type for their data to convey insights effectively.
Dashboards
Dashboards are customisable, information-rich interfaces that provide an overview of key performance indicators (KPIs) and metrics. Users can combine various visualisations, charts, and reports on a single dashboard to monitor trends and make timely decisions.
Data Connectivity
BI reporting tools connect to various data sources, such as databases, spreadsheets, and cloud services. This feature enables users to access and analyse data from multiple locations within a single tool, eliminating the need to switch between different applications.
Interactive Reports
Interactive reports enable users to drill down into data for deeper insights. With interactive features like filtering, sorting, and data highlighting, users can interact with reports to answer specific questions or explore data from different angles.
Types of BI Reporting Tools
BI reporting tools can be categorised based on several criteria. Understanding the types can help you select the right tool for your organisation’s needs.
On-Premises vs. Cloud-Based
On-premises BI reporting tools are installed and run on an organisation’s local servers. They offer complete control over data and infrastructure but require significant maintenance and upfront investment.
On the other hand, cloud-based BI tools are hosted in the cloud, offering scalability, accessibility, and reduced maintenance requirements. The choice between on-premises and cloud-based tools depends on factors like data security, budget, and scalability.
Self-Service vs. Traditional BI Tools
Self-service BI reporting tools are designed for non-technical users, enabling them to create reports and analyse data without IT support. These tools empower business users, reducing the burden on IT departments.
Meanwhile, traditional BI tools often require IT professionals to create and manage reports. Self-service
Open-Source vs. Commercial Tools
Open-source BI reporting tools are freely available and offer flexibility for customisation. Commercial tools have licensing fees but often provide advanced features, support, and integration options. The choice between open-source and commercial tools depends on budget, technical expertise, and organisational requirements.
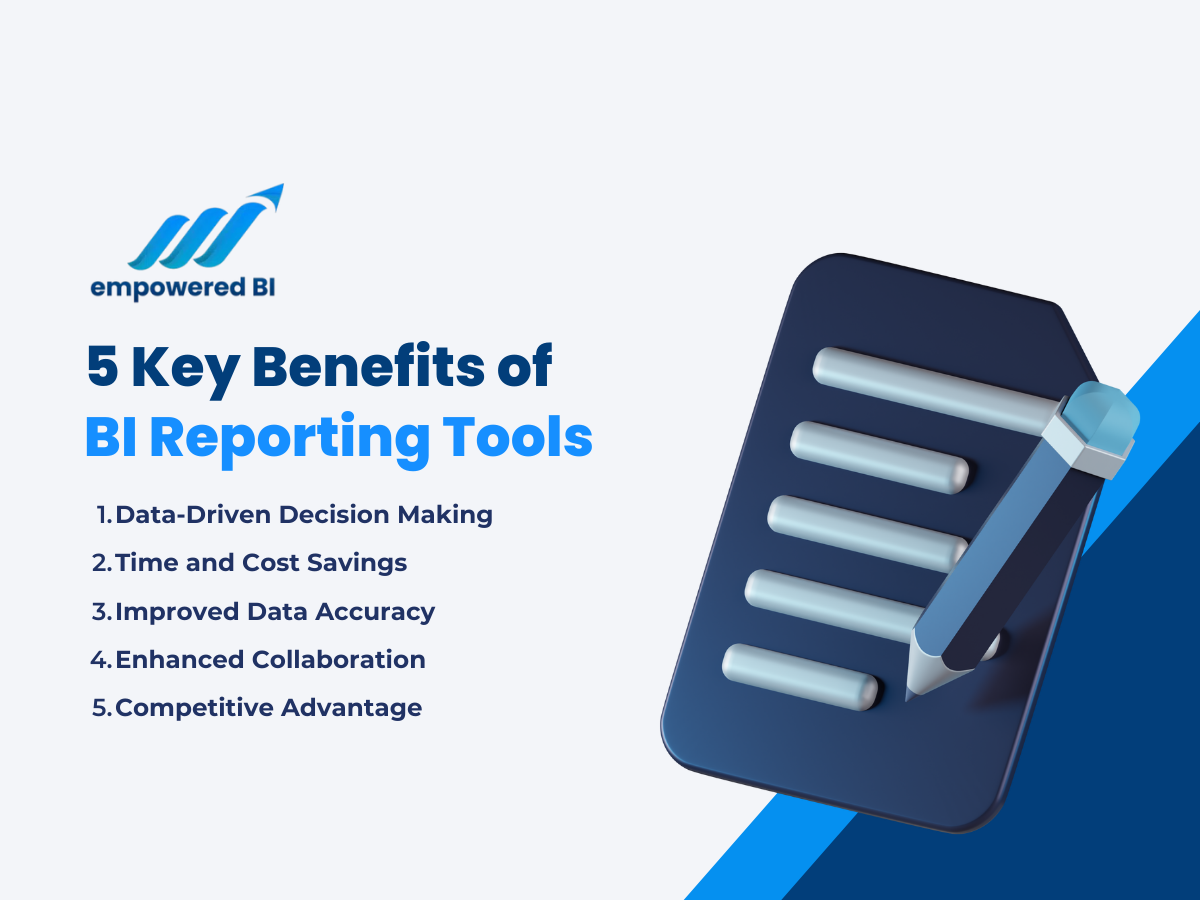
5 Key Benefits of BI Reporting Tools
BI reporting tools offer several advantages that can significantly impact an organisation’s success. Let’s explore some of the key benefits:

1. Data-Driven Decision Making
BI reporting tools enable organisations to make informed decisions based on data rather than intuition or guesswork. These reporting tools make critical information easy to access by transforming it into actionable insight. This data empowers businesses to make strategic choices based on evidence. Likewise, it also empowers decision-makers to choose the most effective strategies.
2. Time and Cost Savings
Traditionally, generating reports and analysing data required extensive manual effort. BI reporting tools automate these processes, reducing the time needed for data analysis. It also reduces the resources necessary for these tasks. This efficiency translates into cost savings and faster response to business needs.
3. Improved Data Accuracy
BI reporting tools ensure data accuracy, automating data collection, consolidation, and reporting processes. It also connects multiple data sources and updates reports in real time. This minimises errors caused by manual data entry and outdated information, leading to more reliable decision-making.
4. Enhanced Collaboration
Business Intelligence (BI) tools enhance collaboration within organisations by providing a centralised data analysis and reporting platform. It allows teams to access the same data from a centralised repository. This eliminates the need for individuals to maintain separate copies of data, reducing the risk of inconsistencies and errors.
With BI Tools, everyone works with the same data source, ensuring data accuracy and uniformity. This visibility helps identify areas for improvement and supports data-driven strategies for growth.
5. Competitive Advantage
BI reporting tools provide a competitive advantage to organisations in several ways by enabling data-driven decision-making and enhancing overall operational efficiency. BI tools provide real-time or near-real-time access to data and insights, allowing organisations to make decisions more quickly. This agility is especially valuable in fast-paced industries where rapid response to market changes can be decisive.
Thus, businesses can make data-backed strategic decisions, respond quickly to market changes, and identify growth opportunities that might otherwise go unnoticed.
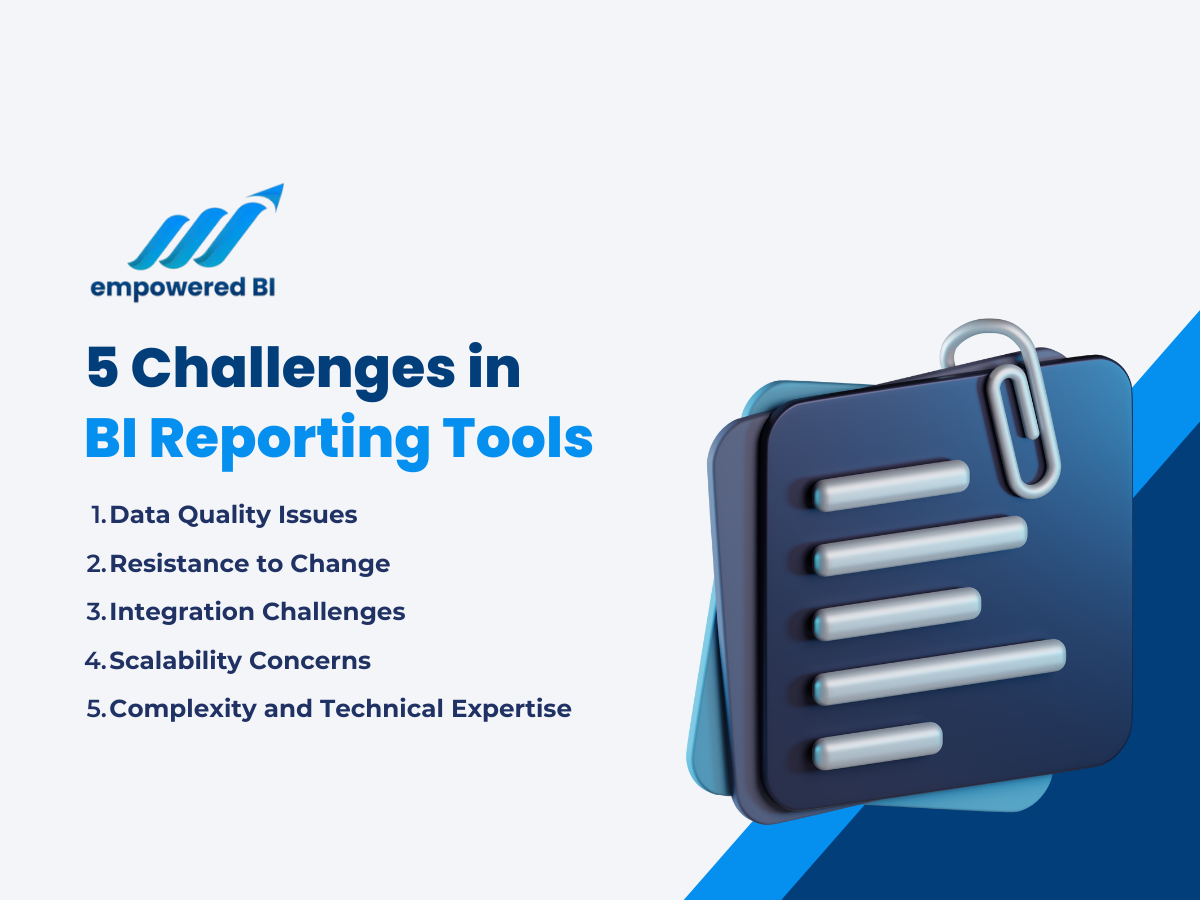
5 Challenges in BI Reporting Tools
BI reporting tools offer numerous benefits but have their fair share of challenges. Here are five common challenges associated with BI reporting tools:

1. Data Quality Issues
When using BI reporting tools, data quality issues are common challenges that organisations face when dealing with data analysis and reporting. BI reporting tools rely on data accuracy. Inaccurate or incomplete data can lead to incorrect insights and decisions.
Thus, regularly monitoring data quality is a must. Businesses must ensure data quality by removing duplicates, inconsistencies, and more.
2. Resistance to Change
Introducing BI reporting tools may face resistance from employees accustomed to traditional reporting methods. Some employees may not fully understand the benefits and capabilities of BI reporting tools, leading to scepticism or reluctance to adopt them.
However, effective change management and training can help mitigate this resistance. Provide comprehensive training and awareness programs to educate users about the tool’s features and how it can improve their work processes and decision-making.
3. Integration Challenges
BI tools often need to connect to diverse data sources, such as databases, spreadsheets, and cloud services. Integrating data from these varied sources can be complex as data from different sources may vary in format, structure, and data types.
To mitigate this, choose a BI reporting tool with robust data integration capabilities to connect to various data sources. In addition, careful planning and data integration strategies are essential to overcome integration challenges.
4. Scalability Concerns
As your organisation grows, you may encounter scalability issues with your BI reporting tool. As data volumes and user demands increase, BI reporting tools may face performance issues unless designed to scale efficiently.
Regularly evaluate your tool’s performance and consider upgrades or alternative solutions as needed.
5. Complexity and Technical Expertise
Complexity and technical expertise issues in BI reporting tools can pose challenges for organisations, especially when users find the tools difficult to navigate or need more skills to maximise their potential. These issues can hinder user adoption and limit the tool’s effectiveness.
So, choose a BI tool with an intuitive and user-friendly interface. Provide training and tutorials to help users become familiar with the tool’s navigation and features. Consider offering customisable dashboards for individual user preferences.
Guide to Choosing the Right BI Reporting Tool
Selecting the most suitable BI reporting tool for your organisation requires careful consideration of several factors. Here are some essential steps to guide your decision-making process:
Define Your Business Needs
Every organisation has unique goals, challenges, and operational processes. Business needs analysis ensures that the chosen BI reporting tool fits these specific requirements well. Selecting a tool that aligns with these needs increases the likelihood of success in achieving business objectives.
So, when picking your BI reporting tool, identify your organisation’s specific requirements. What data do you need to analyse? Who will use the BI tool, and for what purposes? Defining your business needs will help you focus on features that matter most to your organisation.
Consider Scalability
Organisations evolve and expand over time. As organisation grow, they are more likely to collect more data to analyse and report. Thus, scalability is crucial when choosing a BI reporting tool. This will ensure that the tool remains relevant and effective in supporting decision-making in the long term.
Thus, choose a BI reporting tool that can grow with your organisation. Scalability is vital as your data and user base expand. Ensure the tool can handle increased data volumes and user demands without significant performance issues.
Evaluate User-Friendliness
User-friendliness is a critical factor when choosing a BI reporting tool. User-friendly BI reporting tools are intuitive and easy to use, making them accessible to a broader range of users, including those without advanced technical skills. This ease of use encourages widespread adoption within the organisation, ensuring more users can leverage the tool for data analysis and reporting.
When choosing your BI Reporting tool, consider the technical expertise of your users. If your organisation includes non-technical staff, opt for a tool with a user-friendly interface and self-service capabilities. User adoption is crucial for the tool’s success.
Examine Data Integration Capabilities
BI reporting tools should seamlessly connect to your data sources. Ensure that the tool supports your organisation’s databases, spreadsheets, and cloud services. The ease of data integration can impact your reporting efficiency.
Budgetary Considerations
Consider your budget constraints when selecting a BI reporting tool—factor in the initial licensing or subscription costs and ongoing maintenance and support expenses. Make sure the chosen tool aligns with your financial resources.
Conclusion
In today’s data-driven world, BI reporting tools are indispensable for organisations seeking a competitive edge. They empower users to transform data into insights, fostering informed decision-making and improved efficiency.
While the world of BI reporting tools may appear daunting to beginners, understanding their standard features, types, and benefits is the first step toward harnessing their potential. Over time, as you become more proficient in using these tools, you’ll discover new ways to extract value from your data and drive business success.
Ready to harness the transformative potential of Business Intelligence (BI) reporting tools and steer your organisation toward data-driven success? Seize the opportunity to make data work for you. With empoweredBI, you’re not just keeping pace with the future – you’re leading the way. Make data-driven decisions your new norm, and watch your organisation thrive. Start today!

